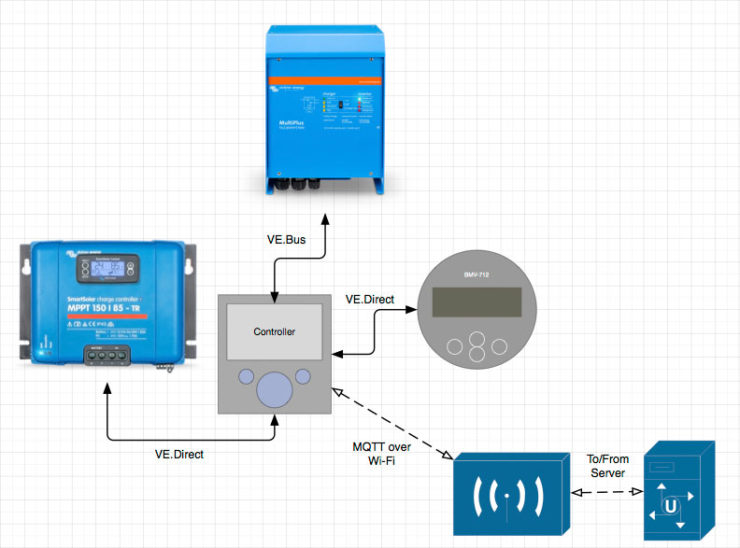
My system is almost entirely Victron. In designing the system, I researched A LOT of options but ultimately decided on Victron for two reasons: (1) price; and (2) the various components I needed were all available from Victron and could communicate with each other. There’s now a third reason: the systems are very open and can easily be made to provide the data I want (I’m a geek).
Victron publishes a large amount of their code and documentation both on GitHub and on their own site, ranging from sample code to construct a custom dashboard to the process for obtaining root access on their Venus-based devices. Of the most interest to me, at least for this project, are the specifications for the data stream available from the system.
Useful Victron documentation and code:
- Venus WebSockets-based web app
- D-Bus to MQTT script and documentation
- D-Bus data documentation
- Venus OS root access
- D-Bus API definition
D-Bus
The D-Bus (Desktop Bus) is the interprocess communication system in use on the Venus OS-based devices (currently the Color Control GX, the Venus GX, and the Octo GX). It’s what the various processes use on the system use to convey information to and from their corresponding connected devices, such as the solar charger and battery monitor. Data like the state of charge, temperature, voltage, and so on all flows through the D-Bus for processing by the system and attached components.
While it has all of the data I want, it’s not exactly in a useful location at this point. The D-Bus is only available to processes running on the device itself and not across the network (it’s technically possible for it to listen for incoming TCP connections but isn’t part of a standard configuration). Fortunately, Victron bundles a script whose sole purpose is to facilitate that kind of use and provides an easy setting to turn it on: D-Bus to MQTT script and documentation
MQTT
Short for Message Queuing Telemetry Transport, MQTT is a network-based protocol for different components of an integrated system (most often used with IoT devices) to send their status to anything connected that wants to listen. The messages contain a data point for some part of the system, such as the current battery voltage from the battery monitor or the altitude reading from the GPS. In a Victron system, most of the messages are electrical in nature for obvious reasons, and virtually every possible measurement is available in some topic (e.g., /Dc/Battery/Voltage — topics are the MQTT term for the ID of a value type and used to subscribe for notifications for it).
At the core of MQTT is the broker, which is the messaging hub, and in a Victron system, it’s the Venus OS-based device that acts as the broker. It receives the messages from different components and clients (e.g., the solar charge controller publishing a notification that the panel voltage changed to 39.25V) and re-broadcasts them to any listeners subscribed. It’s basically a smart repeater that prevents each piece of the system from having to send multiple copies of every message to everything interested by handling that part for them, much like an email mailing list sends a copy of each message out to all subscribers.

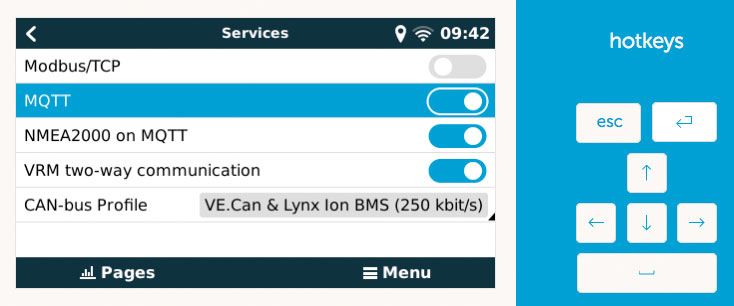
The Victron MQTT broker (an installation of Eclipse Mosquitto) is disabled by default. On the Color Control GX, it’s enabled in the Services screen off the main menu. This is the data source that will be used to both populate a custom real-time dashboard and a historical record of the system’s performance.

Recording
Enabling the MQTT feed only gets me so far — it’s live data, so there’s no displaying historical trends or doing any kind of accumulation calculations. For that, something external to do the recording is needed.
I have a small computer that I use as a dedicated server for my work. It’s set up in a way that I can host multiple “virtual computers” on it, so for this need, I just added another running Ubuntu 18.04 LTS. It’s definitely overkill for this use, but it’s something I already have rather than a new purchase, so it won out. Had I not had it, I probably would have purchased a Raspberry Pi for this and wired it into the DC system — it’s not a high-demand use.
For database needs, my go-to choice is usually MySQL because of my familiarity with it, but in this case I was concerned about the storage capacity needs. At roughly one value per second per measurement type, it would add up quickly with the scheme I’d need to use. Instead, I’d heard about a special-purpose database called InfluxDB. It is a time series database: every entry into it is constructed around a timestamp and measurement, and it’s optimized for storing and accessing that kind of data. For my needs, it’s perfect, and conveniently enough, the dashboard software has excellent built-in support for it.
ryan@local1:~$ influx
Visit https://enterprise.influxdata.com to register for updates, InfluxDB server management, and monitoring.
Connected to http://localhost:8086 version 1.1.1
InfluxDB shell version: 1.1.1
> use monitor
Using database monitor
> select * from dc_battery_voltage order by time desc limit 20
name: dc_battery_voltage
time                device  service system          value
----                ------  ------- ------          -----
1545502302000000000 0       system  xxxxxxxxxxxx    13.810000419617
1545502297000000000 0       system  xxxxxxxxxxxx    13.819999694824
1545502296000000000 0       system  xxxxxxxxxxxx    13.810000419617
1545502295000000000 0       system  xxxxxxxxxxxx    13.800000190735
1545502294000000000 0       system  xxxxxxxxxxxx    13.810000419617
1545502290000000000 0       system  xxxxxxxxxxxx    13.800000190735
1545502288000000000 0       system  xxxxxxxxxxxx    13.789999961853
1545502285000000000 0       system  xxxxxxxxxxxx    13.800000190735
1545502283000000000 0       system  xxxxxxxxxxxx    13.810000419617
1545502281000000000 0       system  xxxxxxxxxxxx    13.819999694824
1545502280000000000 0       system  xxxxxxxxxxxx    13.810000419617
1545502279000000000 0       system  xxxxxxxxxxxx    13.800000190735
1545502278000000000 0       system  xxxxxxxxxxxx    13.789999961853
1545502277000000000 0       system  xxxxxxxxxxxx    13.800000190735
1545502273000000000 0       system  xxxxxxxxxxxx    13.789999961853
1545502272000000000 0       system  xxxxxxxxxxxx    13.779999732971
1545502271000000000 0       system  xxxxxxxxxxxx    13.789999961853
1545502269000000000 0       system  xxxxxxxxxxxx    13.810000419617
1545502268000000000 0       system  xxxxxxxxxxxx    13.829999923706
1545502266000000000 0       system  xxxxxxxxxxxx    13.819999694824

>
To actually glue the two pieces together (i.e., save the values I want from the MQTT stream to the database), I wrote some custom code that handles connecting to the MQTT broker, sending keep-alives, and inserting into the database. The code is in PHP because that’s what I know best and written using the Laravel framework because I wanted to try it out despite it being essentially only a command line program.
The code itself is pretty straight forward, though there were a couple hacky bits to work around odd issues:
- The D-Bus to MQTT script times out after 60 seconds with no read or write requests and clears the last value posted to the broker. Working around this requires sending a read request of some sort regularly — I use a device list read every 50 seconds.
R/{$portalID}/system/0/Serial -
Subscribing to more than a small number of topics prevented any notifications from being sent. Instead, I had to use wildcards on higher level topic paths and just ignore the ones I didn’t want.
R/{$portalID}/system/0/#
R/{$portalID}/solarcharger/#
R/{$portalID}/gps/#
My system is currently collecting two dozen measurements roughly once per second, accumulating data at a rate of roughly 10 MB per day. I’ll never fill the allocated disk space in the lifespan of its disk.
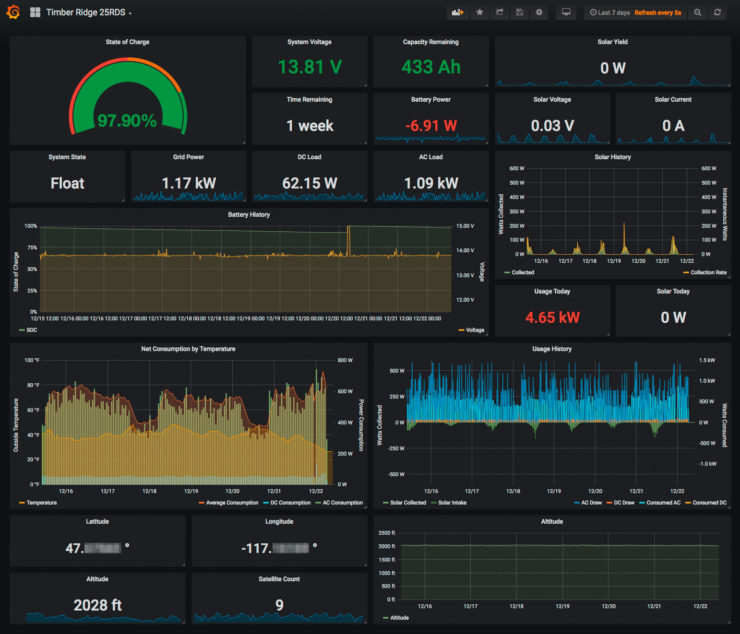
The Dashboard

(The values above represent usage with grid power where electric heat is used rather than propane)
The software powering the dashboard is another I’d only heard of and wanted to try: Grafana. It’s a self-hosted web-based graphing/dashboard system. Using it requires a server to host it on, so I did the obvious approach and just loaded onto the same system where the MQTT client and database live.
Grafana incorporates its own web server, listening on the non-standard port 3000. Rather than use it directly, and because I like nginx for my front-end servers, I set up nginx as a reverse proxy to it.
server {
	listen 80;
	server_name monitor.ryanbritton.com;
	return 301 https://monitor.ryanbritton.com$request_uri;
}

server {
	listen 443 ssl http2;
	server_name monitor.ryanbritton.com;

    ssl_certificate			  /usr/local/ssl/monitor.ryanbritton.com.pem;
	ssl_certificate_key		  /usr/local/ssl/monitor.ryanbritton.com.key;
	ssl_dhparam				  /usr/local/ssl/monitor.ryanbritton.com.dhparam;
	ssl_protocols			  TLSv1.2 TLSv1.3;
	ssl_ciphers               "ECDHE-ECDSA-AES256-GCM-SHA384:ECDHE-RSA-AES256-GCM-SHA384:ECDHE-ECDSA-CHACHA20-POLY1305:ECDHE-RSA-CHACHA20-POLY1305:ECDHE-ECDSA-AES128-GCM-SHA256:ECDHE-RSA-AES128-GCM-SHA256:ECDHE-ECDSA-AES256-SHA384:ECDHE-RSA-AES256-SHA384:ECDHE-ECDSA-AES128-SHA256:ECDHE-RSA-AES128-SHA256";
	ssl_prefer_server_ciphers on;
	ssl_session_cache		  shared:SSL:10m;
	ssl_session_timeout		  6h;
	ssl_stapling			  on;
	ssl_stapling_verify		  on;
	ssl_trusted_certificate	  /usr/local/ssl/monitor.ryanbritton.com.pem;

	access_log	/var/log/nginx/monitor.ryanbritton.com-access.log;
	error_log	/var/log/nginx/monitor.ryanbritton.com-error.log;

	client_body_in_file_only clean;
	client_body_buffer_size 32K;

	client_max_body_size 300M;

	sendfile on;
	send_timeout 300s;

	# Forward to Grafana
    location ~* ^/ {
        proxy_pass http://127.0.0.1:3000;
        proxy_set_header Host $http_host;
        proxy_set_header X-Forwarded-For $remote_addr;
        proxy_set_header X-Forwarded-Proto 'https';
        proxy_set_header X-HTTPS '1';

        add_header X-Frame-Options SAMEORIGIN;
        add_header X-Content-Type-Options nosniff;
        add_header X-XSS-Protection "1; mode=block";
        add_header Strict-Transport-Security "max-age=31536000; includeSubDomains; preload";
    }
}
The end result is a TLS-ready dashboard with full authentication support should I ever decide to make it accessible on the broader internet.
Some data points I’ve configured it to display are calculations or cumulations of existing values and don’t exist independently in the MQTT feed. Because Grafana’s data must exist as a literal response from the linked database, it was necessary to do the preprocessing in PHP during the collection phase
Among the data I’ve configured it to collect and present are:
State of Charge
The state of charge of the batteries is arguably the most important piece of information, especially during winter use where the capacity and freezing point of flooded lead acid batteries change. I configured it to colorize the text based on the state of charge, red meaning it’s entering the danger zone both for longevity of the battery and the freezing point of the electrolyte.
Current Consumption Rates and Loads
Spread across a few different readouts, I can get a decent snapshot of how much power is being used by both the AC and DC electrical systems and where that power is coming from (i.e., shore power/generator or the batteries). Combined with the the displays for amp-hours remaining and time estimate, I can have some idea of how sustainable a load is.
Battery History
The battery history graph allows me to easily see when the last full charge started, when it switched from bulk to absorption, and when it finished up and switched back to float. This kind of information is useful for estimating how long a charge cycle will take.
Consumption by Temperature
We definitely consume more power in colder weather as the furnace is the largest single DC draw in the trailer. Being able to look up previous usage averages and energy requirements will help in trip planning.
Solar
Like the consumption measurements, a robust solar history will provide useful information for trip planning. Different locations and times of year mean different amounts of solar collection are possible, which can be used to estimate if and how much generator fuel may be needed.
GPS
Associating GPS location information with the measurement history isn’t strictly necessary, but it makes it a lot more useful. Knowing our solar yield was low because we were parked in a mountain shadow is useful information to hav when planning to go back. Additionally, my satellite modem requires an accurate GPS reading to know which beam to associate with and provide pointing parameters.
Future Additions
I have more ideas for this system than I could possibly incorporate. On the more realistic end, this includes inside temperature monitoring, furnace run time tracking, propane consumption rate tracking, incorporating weather data, linking in with the TPMS sensors, tracking the fuel economy while towing, and repurposing an old iPad as a dedicated monitor.
Much of this leverages equipment I already have or is fairly inexpensive, so the only barrier is the time to do it. I’m currently working on decoding the Bluetooth LE broadcast payload of some propane tank sensors.
0d000002 74001f28 fb812a82 00000000 00000000 001586ca 4b